If the World Were a Village
If the World Were a Village
A gallery based on the book, 'If the World Were a Village' by David J Smith and Shelagh Armstrong, has opened and needs some exhibits. All of these must be based upon the data from within the book. It is important to be thoughtful about how the data are presented because sometimes key messages can be missed out because of the way the data are shown.
In the book, the world's population ($6, 660, 000, 000$) is represented in the imaginary village of $100$ residents so that each resident represents approximately $67$ million people from the real world.
Here's an example:
In the village, there are $100$ people:
 or
or 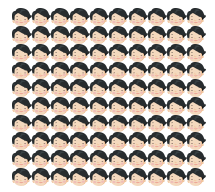 or
or 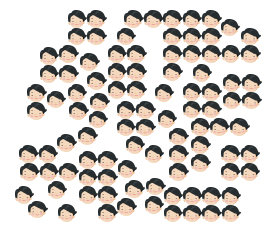
What do you think? In your opinion, which shows us the $100$ people in the best way?
Here's another example:
In the village, $61$ people are from Asia; $13$ are from Africa; $12$ are from Europe; $8$ are from South America, Central America and the Caribbean; $5$ are from Canada and the United States; $1$ is from Oceania. How shall we represent this?
This time $1$ flag represents $1$ person.
| Asia |
$61$ |
| Africa |
$13$ |
| Europe |
$12$ |
| South America, Central America and the Caribbean |
$8$ |
| Canada and the United States |
$5$ |
| Oceania |
$1$ |
or
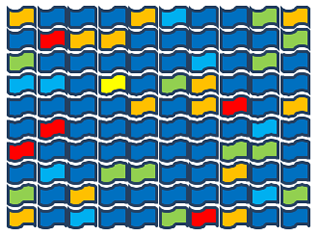
or
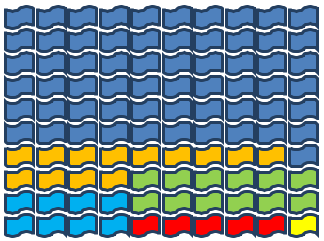
or
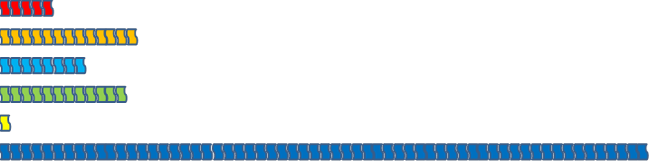
What do you think? All of them show exactly the same information.
Which representation makes you realise that there are $100$ people? Which one makes you realise that there are LOADS more people from Asia than anywhere else? Which was easiest to count? Did you notice how a flag had been used because that was linked to the topic?
Your challenge will be to decide how to represent some more of the data from the book. Here are some suggestions but you could choose your own data if you have a copy of the book.
Electricity:
$76$ have electricity. $24$ do not.
In the village, the people with electricity have between them: $42$ radios, $25$ televisions, $61$ telephones and $15$ computers.
Air and Water:
$82$ have access to a source of safe water either in their homes or within a short distance. $18$ do not and must spend a large part of each day simply getting safe water. Most of the work of collecting water is done by women and girls.
$64$ have access to adequate sanitation - they have public or household sewage disposal - while $36$ do not.
$68$ breathe clean air, while $32$ breathe air that is unhealthy because of pollution.
We are looking forward to seeing your different representations.
Many thanks to Vivien Townsend for creating this activity and the accompanying teachers' notes.
Why do this problem?
Engaging children with real data is a very valuable process. The data in this book are real, engaging and meaningful. There is nothing here about favourite colour - this is real life and death stuff. As well as interpreting real data, this activity presents the opportunity to consider how data are presented and interpreted.
There are plenty of opportunities to use a variety of mathematics. More and less, and difference, will be covered as data are discussed. Depending on how the data are presented, children will be approximating amounts and using the vocabulary of fractions and ratios in order to make sense of the information. Through this process, they will gain a good understanding of what amounts
'look' like. As the village has $100$ residents, number bonds to $100$ will also feature. With older children, this could link to work with percentages.
There are obvious cross-curricular links with Geography and PSHE here as the data in the book really make us think about the haves and have-nots of our world, the differences between countries and peoples, and also what unites us all.
Possible approach
Ideally, you will need a copy of the book 'If the World Were a Village' by David J Smith and Shelagh Armstrong (published by A&C Black, ISBN 978-0-7136-6880-3).
Begin by reading the welcome message on page $7$. Here, the author explains how the world's population ($6,660,000,000$) is represented in the imaginary village of $100$ residents so that each resident represents approximately $67$ million people from the real world.
Share the images here and ask the children to interpret the information. It'll be worth having access to a world map! Discuss the merits of different representations and, if appropriate, compare the data with that of your school community. You might also consider using 100 CHILDREN to represent the village. This would be especially powerful when you come to talk about issues such as who has
wealth, electricity, televisions - things that your class will feel strongly about! If you're one of the 100 who doesn't have a TV then how does that feel?
In groups, give the children a set of data and ask them to decide how to present it. Some of the pages in the book are easier to interpret and represent than others, so there's some natural differentiation.
Provide a range of resources to use to represent the information: cubes, bean bags, post-it notes, images that can be cut out, paper and pens, small world models, dried pulses/pasta, beads ... Expect groups to change their minds about how to present their data. They want their representation to have maximum impact - you might even insist that they try a number of different
representations before deciding on their final arrangement.
Once the data are presented in a physical/visual way, you might ask each group to prepare a little 'fact-sheet' about their data so that 'visitors' to the class 'gallery' can understand what they're looking at. This information could also of course be recorded on small devices (such as Talking Tins or Talk-Time Postcards) which could be sited next to the displays.
When the 'gallery' is opened, the group members can take it in turns to be the 'curator' of their data and explain what they show to 'visitors'. This requires a certain amount of role playing on all parts! The visitors can be children from their own class, other classes from within the school, parents, members of staff, governors ...
Working in this way provides more cross-curricular opportunities because there may be a need to make invitations, issue tickets, serve refreshments, run a cloakroom, carry out security checks and much else besides!
Key questions
What does this data show?
What does this tell us?
What do you think about that?
How is this different from ...?
If you were in the village, where would you be?
How many more/less ...?
Approximately how many is this?
How will you represent this information?
Is there another way?
Is this the clearest way for someone visiting the gallery?
Possible extension
Children could collate their own information from their class or school and represent this. This could tie in with other class topics. For example, from our class:
- How many TVs/cars do we own?
- What do you read before going to sleep?
- How long do you spend learning your spellings?
- How many people live in your house?
Possible support
Children may need to see various representations in order to feel confident to create their own. Encourage children to make changes - it's easy to change back! Encourage children to consider whether their representation is fair and whether what they've chosen to use is suitable.