Conditional Probability Is Important for All Students!
 For many students, conditional probability seems to be too hard, and pointless anyway. Frankly, who cares what the chance is of getting a blue ball, given that the previous one was red. And who wants to get tangled up
with Bayes' Theorem?
For many students, conditional probability seems to be too hard, and pointless anyway. Frankly, who cares what the chance is of getting a blue ball, given that the previous one was red. And who wants to get tangled up
with Bayes' Theorem?
If that's how it's taught, then yes, it is dry, apparently pointless, and difficult to justify spending time and effort on.
But if conditional probability is about the chance that a positive test for cancer means you actually have cancer - that matters. If it's about understanding why a simplistic approach to probability leads to miscarriages of justice - that matters. These are questions which can have life and death implications.
A psychologist, Gerd Gigerenzer (see a short article giving his approach here), in Reckoning with Risk: Learning to Live with
Uncertainty, gives this example:
The probability that a woman of age 40 has breast cancer is about 1 percent. If she has breast cancer, the probability that she tests positive on a screening mammogram is 90 percent. If she does not have breast cancer, the probability that she nevertheless tests positive is 9 percent. What are the chances that a woman who tests positive actually
has breast cancer?
The chance that even a well-informed person calculates this probability correctly from information presented in this form is not high. That wouldn't matter if it were purely a mathematical problem, but failing to understand information given in this way is at the root of many medical and legal miscalculations. And no - the correct answer is not about 90% - although you could be
forgiven for thinking that it is!
The same problem can be presented in this way:
Think of 100 women. One has breast cancer, and she will probably test positive. Of the 99 who do not have breast cancer, 9 will also test positive. Thus, a total of 10 women will test positive. How many of those who test positive actually have breast cancer?
The answer is that only 10% of women whose mammogram indicates a problem actually have breast cancer - a huge difference.
The NHS in the UK has taken this on board, and they now present information for women called up for breast screening in this way, so that women can make an informed decision about whether to go for screening or not. It's a pity that as yet (February 2013) they have not extended this to all their cancer screening. The booklet
Bowel Cancer Screening: The Fact tells me
that about 1 in 20 people in the UK will develop bowel cancer during their lifetime, that it is the third most common cancer in the UK, and the second cause of cancer deaths, with over 16 000 people dying from it each year. It continues: "Regular bowel cancer screening has been shown to reduce the risk of dying from bowel cancer by 16%" (p2).
16% of what? Without any reference point for this statistic, how am I supposed to make sense of it, and assess my own risk? The increase from 5 in 100 to 6 in 100 is a 20% increase, but it may not worry me too greatly, unless I have reason to suppose I'm likely to be that particular individual (see
here for an article and
animations on how risks can be 'spun' to make them look more dramatic).
All of this is by way of saying that it is vital that students - all students, not just the higher achievement groups who will do higher level exams - need to be helped to understand conditional probability.
We believe that our problems provide students with contexts and structure which will enable them to do this:
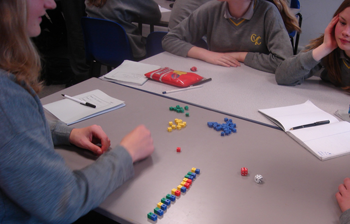
- The Dog Ate My Homework - this is an introduction to conditional probability, aimed at 12-14 year-olds. A practical experiment using dice and multi-link cubes gives data which can be used to answer questions like 'What is the chance that a student who is not lying about their homework is nevertheless accused?' The practical representation
of data using the multi-link cubes helps students to appreciate that this is not the same question as 'What is the chance that a student who is accused is not lying about their homework?'
- Who Is Cheating? - this provides a full introduction to the theoretical probability required by GCSE and similar syllabi, and is aimed at 14-16+ year-olds. Again, there is a practical experiment using dice and multi-link cubes, providing data for an initial exploration of questions such as 'What is the probability that an athlete who is
taking a banned substance tests negative?' and 'What is the probability that an athlete who is not taking the banned substance nevertheless tests positive?'
These scenarios can easily be adapted to others. Teachers on a course in South Africa recently came up with these:
- What is the chance the weather will be sunny tomorrow, if it is raining today?
- What is the chance that a Grade 10 girl will complete her education if she becomes pregnant? How does this compare with a Grade 10 girl who does not become pregnant?
There is a common lesson structure for these problems. Students start by answering questions from their own results, and from the aggregated results of the whole class, using a tree diagram and 2-way table to represent their results and provide a structure to interpret the data. They then use their intuitive understanding of random events (dice and coins) to see what results they
would expect, comparing the experimental data with the expected results.
The expected results, also displayed as whole numbers on a tree diagram and 2-way table, provide the data to answer questions which progress from: 'What proportion of people who experience A do we expect to experience B also?' to: 'What is the chance that a person who experiences A experiences B also?'; 'Is this the same as the chance that a person who experiences B also experienced A?'
From this students answer questions of the form: 'Given that a person experiences A, what is the probability that they also experience B?' Reversing the tree diagram enables them to answer 'Given that a person experienced B, what is the probability that they also experienced A?'
Exploring all these forms of questions in this way enables students to investigate data in order to answer worthwhile questions such as 'If a person tests postive for cancer, what is the probability that they are actually suffering from cancer?' or 'If a person has two children who both die apparently from SIDS, what is the probability that this occurred by chance?'
From this, those for whom it is approriate can go onto
Bayes' Theorem with a sound understanding of the basis for theory and formula.